|
|
|
|
|
|
|
|
Design Features: |
|
|
|
|
|
|
|
|
|
 |
|
 |
Tubesheet Mapping |
|
|
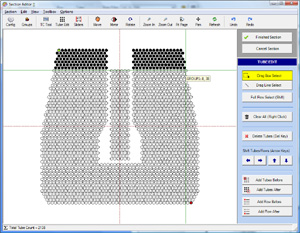
Built-in map generator allows you to quickly build maps for all types of
components. Examination results can be displayed in standard or custom
formats. Convenient drawing tools give a professional CAD look without
needing to invest in an extensive learning curve. Create customized
drawings and maps for exchangers, condensers, boilers and pressure vessels. |
|
|
|
|
|
|
|
|
|
|
|
|
|
|
 |
|
|
|
Quick Editing Features |
|
|
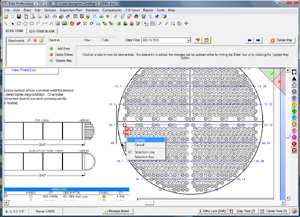
Have you ever found yourself needing to make a quick change, or update some
tubes that have recently been plugged? The hot keys allow you to simply
click on a 'legend item', then click on any tube, update and your done. In
addition, you could click on any tube in the map and update it directly within
the maps datasheet. |
|
|
|
|
|
|
|
|
|
|
|
|
|
|
 |
|
|
|
Map Manager |
|
|
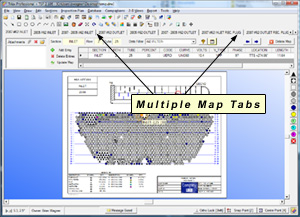
This feature allows you to have multiple maps in one drawing file. A must
for condition assessment, you can compare superimposing the results of any two
examinations and present the results in your choice of formats (map, graph or
text). |
|
|
|
|
|
|
|
|
|
|
|
|
|
|
 |
|
|
|
Comparisons / Historical |
|
|
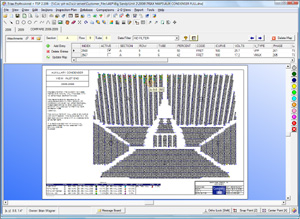
Comparisons can be made on overall or specific damage types. For example,
compare only pit type damage or only wear type damage. Comparisons are
also linked to the report editor so reports can be generated specifically for
growth rate assessment using built-in routines. |
|
|
|
|
|
|
|
|
|
|
|
|
|
|
 |
|
|
|
2-D Flaw Plotting |
|
|
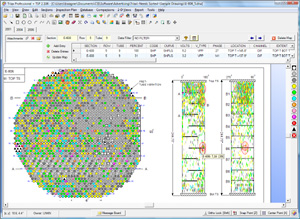
Data results are directly applied to a 2-D model of the component.
The model can be generated using the built-in wizard and positioned horizontally
or vertically to show top, bottom and/or size views. This allows for
extremely detailed assessments as damage can be displayed by type, location,
depth or any combination of parameters. Simply click on a tube, and the
indication location is highlighted on the 2-D view for quick assessment. |
|
|
|
|
|
|
|
|
|
|
|
|
|
|
 |
|
|
|
Reporting |
|
|
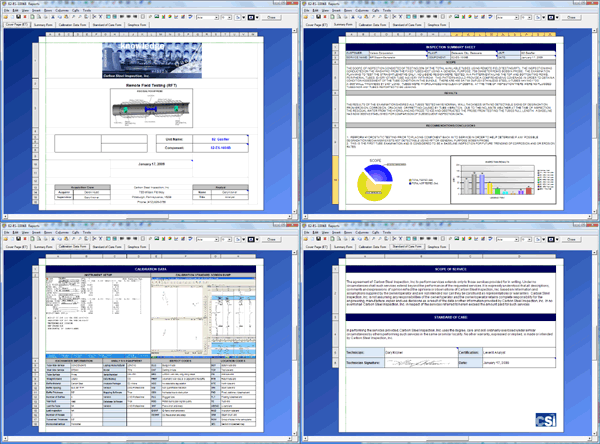
The built-in smart reporting feature actively links data from the map and
datasheet(s) directly to the report. The custom report formats can be tailored by
the user to quickly generate detailed final reports for fast turnaround for
end-of-day status. Easily import any results in text format from prior
reports. The push button design creates internal intelligence to simplify
queries without having to know SQL. |
|
|
|
|
|
|
|
|
|
|
|
|
|
|
